Teleworking, AI and the labour force
This chapter provides an overview of “teleworkability” – the extent to which all tasks relating to an occupation can be performed remotely – and people’s changing attitudes towards working from home. There is considerable variation in teleworkability, both across and within the EBRD regions, with young people and women more likely to have teleworkable occupations than older cohorts and men. On average, workers plan to work from home two days a week after the Covid-19 pandemic, with many people feeling that they work more efficiently at home. This chapter also explores the impact that artificial intelligence is having on the labour market, showing that, while the effect is limited, occupations which are more exposed to automation have seen greater job losses.
Introduction
Digitalisation of the workplace has taken a leap forward during the Covid-19 pandemic and is changing the ways in which people work and the jobs that they do. In particular, use of digital technologies that are complementary to human effort (especially when working from home) has increased. Cloud computing, online contracting and digital payment systems are all prime examples of this. Evidence from advanced economies indicates that highly skilled, high-income workers tend to benefit most from remote-working arrangements.1 This chapter starts, therefore, by looking at how “teleworkability” – a measure capturing the extent to which all tasks relating to an occupation can be performed remotely – is distributed in terms of geography, gender, age and educational attainment in the EBRD regions (see Box 3.1 for details of the construction of that measure).2 While the measure in question does not indicate whether tasks are actually performed remotely, this chapter complements that teleworkability analysis by looking at de facto remote-working patterns.
Teleworkability: transforming how people work
People’s recent experience with teleworking, the associated investments made and the protracted nature of the pandemic will probably mean that remote working remains popular in many economies in the near future, potentially increasing further over time. Increased teleworking could have a considerable impact on labour markets in the EBRD regions.
Source: Dingel and Neiman (2020), labour force surveys (2016-19) and authors’ calculations.
Source: Dingel and Neiman (2020), labour force surveys (2014-19) and authors’ calculations.
Source: PIAAC and authors’ calculations.
Note: “Good ICT skills” refers to an average score of more than 290 across the 10 plausible values for problem solving in a technology-rich environment. See also Chapter 2 of EBRD (2018).

Source: Dingel and Neiman (2020), labour force surveys (2016-19) and authors’ calculations.
Note: This map is used for data visualisation purposes only and does not imply any position on the legal status of any territory.
Source: Dingel and Neiman (2020), labour force surveys (2016-19) and authors’ calculations.
- EBRD regions
- Advanced economies
Source: Dingel and Neiman (2020), labour force surveys (2016-19) and authors’ calculations.
- EBRD regions
- Advanced economies
Source: Dingel and Neiman (2020), labour force surveys (2016-19) and authors’ calculations.
Source: European Social Survey (2008-16), labour force surveys (2016-19) and authors’ calculations.
Note: This chart plots the marginal increase in the percentage of employees working from home “at least sometimes” that is associated with a one unit increase in the different variables. The trust variable is standardised, so the point estimate gives the marginal increase in the percentage of people working from home that is associated with a 1 standard deviation improvement in trust in other people. Square brackets indicate 95 per cent confidence intervals. See Box 3.2 for further details.
Working from home: attitudes and expectations
The sudden closure of workplaces during the pandemic ushered in a new era of remote working for millions of employees and triggered a significant shift in the attitudes and expectations surrounding remote working. This section draws on the results of a new large-scale online survey that the EBRD and the ifo Institute recently conducted in 15 countries (including 7 economies in the EBRD regions), the respondents for which were representative of the working-age population in terms of age, gender and educational attainment. The purpose of the survey was to understand employees’ experiences with working from home (in terms of time allocation, efficiency and future preferences) and employers’ post-pandemic plans as regards remote working. While the survey provides early insights into such patterns and preferences, the limitations of online surveys should be borne in mind when considering the analysis that follows. In particular, online surveys may suffer from sampling bias, as certain sections of the population (such as elderly and rural residents) are less likely to have internet access and respond to online questionnaires, whereas the young, those living in cities, and those with higher levels of education and better digital skills are more likely to respond.
Source: EBRD-ifo survey (2021) and authors’ calculations.
Note: This chart shows the percentage of respondents aged 20-59 who worked from home (i) one or two days, (ii) three or more days, or (iii) no days at all in the survey week, broken down by country. The survey question was: “How many full paid working days are you working from home this week?”
Source: EBRD-ifo survey (2021) and authors’ calculations.
Note: Respondents who were unaware of their employer’s plans (19 per cent of respondents) and those who did not have an employer at the time of the survey (4 per cent) have been omitted from this analysis.
Source: EBRD-ifo survey (2021) and authors’ calculations.
Note: The survey question was: “How does your efficiency working from home during the Covid-19 pandemic compare to your efficiency working on business premises before the pandemic?”
Source: EBRD-ifo survey (2021) and authors’ calculations.
Note: The survey question was: “Since the Covid pandemic began, how have perceptions about working from home changed among people you know?”
Advances in AI: transforming the jobs that people do
AI technologies can perform tasks that humans would otherwise do. Such tools can be both labour saving and labour-augmenting, so they have the potential to both displace and create jobs.
Jobs that can be done by AI
The 10 per cent of occupations with the highest AI exposure scores account for only 6.3 per cent of jobs in the EBRD regions (with that percentage ranging from 3.6 per cent in the Slovak Republic to 11.8 per cent in Mongolia; see Chart 3.13). Thus, AI technologies threaten substantially fewer jobs than non-AI automation.
Source: Felten et al. (2018), Frey and Osborne (2017), labour force surveys (2016-19) and authors’ calculations.
Note: An occupation has a high level of exposure to non-AI automation if the probability of computerisation, as defined by Frey and Osborne (2017), exceeds 0.7. Similarly, an occupation has high exposure to AI automation if its normalised AI exposure exceeds 0.7. See Box 3.1 for details.
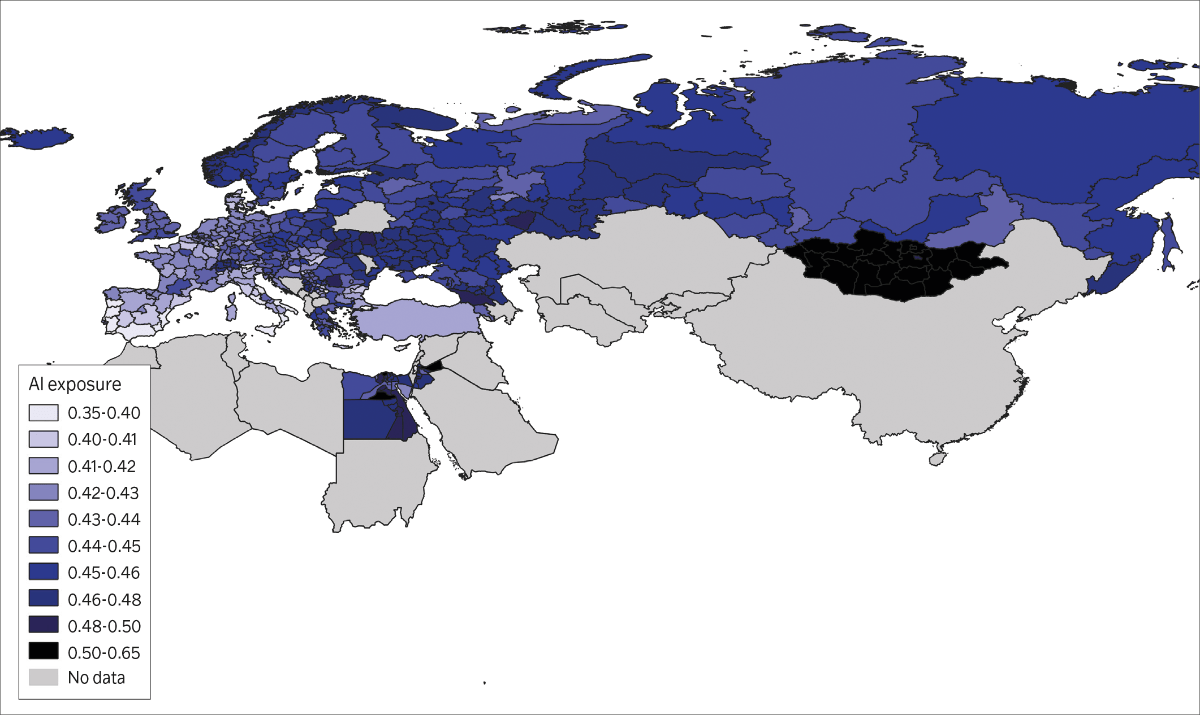
Source: Felten et al. (2018), labour force surveys (2016-19) and authors’ calculations.
Note: This map is used for data visualisation purposes only and does not imply any position on the legal status of any territory.
Source: Felten et al. (2018), labour force surveys (2016-19) and authors’ calculations.
Source: Felten et al. (2018), labour force surveys (2016-19) and authors’ calculations
Source: Dingel and Neiman (2020), EU labour force surveys (2011 and 2019), Felten et al. (2018), Goos et al. (2014), Webb (2019) and authors’ calculations.
Note: This chart plots the marginal increase in the share of national employment that is associated with a 1 standard deviation increase in the different variables, broken down by industry and occupation. Square brackets indicate 95 per cent confidence intervals. See Box 3.2 for details of the regression.
Conclusion
The digitalisation of the workforce is changing the ways in which people work and the jobs that they do. Covid-19 has accelerated pre-existing trends, particularly by bringing forward some workers’ geographical separation from the office. Across the EBRD regions, women are more likely to have teleworkable occupations than men. However, they are also less likely to work from home in practice. And while highly educated workers in the EBRD regions are up to three times more likely to have a teleworkable occupation than workers with lower levels of education, the rate at which they work from home is far lower than that of their peers in more advanced economies. Some of that is to do with trust, since people in regions with lower levels of interpersonal trust are less likely to work from home, even after controlling for occupational characteristics.
Low levels of digital skills are probably also a barrier to increases in remote working, especially among older workers. Unlike in advanced economies, older cohorts in the EBRD regions are less likely to have teleworkable occupations. However, even young people in the EBRD regions have weaker ICT skills than their peers in more advanced economies.
When it comes to actual remote working, workers have proven that they can be productive outside of the workplace, and acceptance of remote working has increased. Survey respondents have indicated that they want to keep working from home after the pandemic ends, planning to work about two full days per week from home. These results suggest that, broadly speaking, working from home is likely to become more acceptable in the longer term.
The pandemic may also be accelerating firms’ adoption of AI technologies. Workers who perform routine cognitive tasks may start to see many of those tasks being executed by AI. While occupations with the highest exposure to AI account for only a small percentage of overall employment, some sectors may be dramatically affected, including sectors not traditionally thought of as digital-intensive. The impact of AI can be expected to increase over time. Thus far, the effect of high AI exposure on employment growth at occupation level has been negative but not statistically significant. Meanwhile, the impact has been marginally greater for highly skilled workers in highly exposed industries, pointing to possible productivity effects.
These findings have several policy implications. First, increases in teleworking may lead to de-urbanisation.28 Regions with high levels of teleworkability may then lose low and medium-skill jobs that serve the commuting population. The resulting reduction in the tax base could also weigh on local spending on infrastructure, maintenance and other public goods. Monetary support for cities undergoing such a transition will be important – for example, so that local governments can help to match remaining residents to appropriate jobs.
Second, the upgrading of skills will be essential for economies in the EBRD regions. Private sector-led digital training programmes can send clear signals about demand for skills, while also increasing supply. Moreover, closing the gap in terms of ICT-related skills will help the EBRD regions to leverage the benefits of future technological change while minimising any disruptive impact that digitalisation has on the labour market. At the same time, this may potentially make economies in the EBRD regions more attractive as destinations for teleworkable jobs offshored from advanced economies.
Third, although AI technologies have not yet had a significant impact on employment at occupation level, job vacancies advertised by highly exposed firms are showing increased demand for skills that complement AI, implying an intention to make greater use of AI moving forward.29 This suggests that policymakers should be aware of the potential for job displacement – not only for low and medium-skill occupations, but also for some highly exposed, high-skill occupations. Specific suggestions in this regard include: (i) providing child support payments to displaced parents, in order to mitigate the intergenerational impact of job losses; (ii) encouraging collaboration among private-sector partners with a view to helping workers to find new employment; (iii) helping people to deal with the psychological impact of job displacement, for example by raising awareness of and increasing support for displaced people within their communities; and (iv) broadening eligibility for wage support payments, for instance by making them available to part-time employees.
Box 3.1. Constructing measures of teleworkability and exposure to AI
This box explains the measures of teleworkability and AI exposure that are used in this chapter, which are constructed in line with Dingel and Neiman (2020) and Felten et al. (2018) respectively. In this analysis, each occupation is defined as a finite collection of core tasks, which require specific skills. For example, a chief executive carries out a broad range of tasks, such as “making decisions and solving problems” and “developing and building teams”.
Teleworkability
An occupation is considered to be teleworkable if all of the relevant tasks can be performed remotely. Occupations that are not teleworkable involve at least one task that cannot be carried out remotely. The task content of occupations is sourced from the “work content” and “work activities” modules of the O*NET database. That database contains data on 1,000 occupations in the United States of America (disaggregated at the level of six-digit SOC codes). Data are collected by surveying randomly sampled workers, as well as occupation experts. A median of 25 workers are surveyed per occupation.
AI exposure
The measure of AI exposure relies on data on the ability requirements of each occupation, based on 52 distinct abilities recorded in O*NET. Examples of abilities include spatial orientation, fluency of ideas and reaction time. In addition, each AI technology is characterised by the speed of its progress between 2010 and 2015, using data from the Electronic Frontier Foundation (EFF) and the methodology in Felten et al. (2018).
Box 3.2. Regression analysis
Trust and propensity to work from home
In the analysis of the importance of trust for the propensity to work from home, working from home for at least one hour per week is linked to the average level of trust in a person’s region of residence, the percentage of households with broadband internet and individual level characteristics (including occupation (at three-digit level), industry of employment (at one digit level) and country of residence).
Changes in employment and exposure to AI
Linear probability model regressions relate (i) relative changes in employment between 2011 and 2019 in a bin comprising a given occupation, level of educational attainment and country (as a percentage of total employment) to (ii) the measure of AI exposure for a given occupation. A similar specification is used to relate (i) changes in employment at country-industry-occupation-education level to (ii) AI exposure at both industry and occupation level. Another key coefficient of interest is that of a binary dummy for tertiary education. Interaction terms combining AI exposure and tertiary education are included to assess the differential impact that AI has on low and high-skilled workers.
Box 3.3. The expansion of mobile internet and increases in the desire to migrate
Digital technologies – particularly broadband internet, mobile phones and other means of sharing information digitally – have profoundly changed the ways in which people connect, meet and exchange information. This rapid technological progress has also led to increased interest in the socio-economic and political impact of widespread access to the internet, with the number of internet users worldwide rising from 413 million in 2000 to nearly 4.1 billion in 2019.30
Source: Gallup World Poll and authors’ calculations.
Note: This chart reports estimated coefficients from a linear probability model regressing stated intentions to migrate on the percentage of the local population that has access to mobile internet. Controls include (i) gender, (ii) age, (iii) age squared, (iv) marital status, (v) the presence of children in the household, (vi) whether the respondent lives in an urban area, (vii) educational attainment, (viii) whether the respondent was born in the country, (ix) satisfaction with housing, health care, education, roads, transport, the city and life in general, (x) other attitudes, experiences and beliefs, (xi) the log of average per capita income in the region, (xii) the log of per capita income in the respondent’s household, (xiii) the Polity 2 score and (xiv) the percentage of respondents under the age of 30. The 95 per cent confidence intervals shown are based on standard errors with two-way clustering at country-year and region level. The unit of analysis is at individual level.
Box 3.4. Could automation exacerbate the gender pay gap?
Building on Aksoy et al. (2021), this box provides large-scale evidence on the impact that the adoption of robots has on the gender pay gap, studying 20 European countries over the period 2006-14. Specifically, the box looks at how robotisation (as measured by increases in the number of robots per 10,000 workers between survey years) affects the gender gap in the monthly earnings of workers in sectors that commonly employ robots (manufacturing of vehicles, plastics and chemicals, metals, food and beverages, electrical equipment, wood and paper, and textiles, as well as other manufacturing, mining, education and research, construction and utilities).
Findings
This box estimates a conditional gender pay gap – defined as the difference between the earnings of men and women of a similar age residing in the same country who work within the same occupational category and industry and in firms of a similar size – which is calculated on the basis of data from Eurostat’s Structure of Earnings Survey. Thus, the conditional pay gap takes account of many factors that may account for differences between men’s and women’s earnings and is closely related to the principle of “equal pay for equal work”. The analysis links the conditional gender pay gap to the rate of increase seen in the use of robots in a specific sector and country (as obtained from the International Federation of Robotics), as well as a number of other characteristics (such as the industry and country in question).
The results suggest that robotisation increases the gender pay gap, with a 10 per cent increase in robotisation leading to a 1.8 per cent increase in the conditional gender pay gap across the sample as a whole (see Chart 3.4.1).
Mechanisms
The results probably reflect the fact that men’s productivity has increased more in response to robotisation, especially in medium and high-skill occupations. In other words, women tend to be under represented in medium and high-skill occupations in industries where workers’ productivity is enhanced by robotisation. This exacerbates the gender pay gap, especially in countries where gender inequality was already severe. Since this analysis is based on a conditional gender pay gap, the results cannot be explained by changes in the gender composition of the workforce, either across the economy as a whole or in specific sectors.
Implications
In order to lean against this trend, governments need to ensure that education and vocational training systems provide all people – irrespective of their gender and other characteristics – with the skills they need to take advantage of technological progress. People in sectors affected by automation could, for example, benefit from targeted reskilling programmes. Dedicated funding for education providers that is tied to gender equality in training programmes or targeted support for childcare can also help to mitigate the unequal impact of automation across genders.
Source: Structure of Earnings Survey, International Federation of Robotics, EU KLEMS and authors’ calculations.
Note: This chart reports coefficients from instrumental variable regressions of the conditional gender gap in median monthly earnings in a given country-sector pair on the level of robotisation (inverse hyperbolic sine transformation of changes in the number of robots per 10,000 workers). The instrumental variable is replaceable hours, which measures the percentage of each industry’s hours in 1980 (before robotisation) that were performed by occupations and later became susceptible to replacement by robots. The analysis is performed at “demographic cell” level (whereby data are collapsed by country, industry, year, age group, occupation and firm size). All regressions include a constant, the age group, the occupational group, the percentage of full-time workers, a dummy for firms employing more than 250 workers, the percentage of female workers, and the change in the percentage of female workers for a given country-sector pair. The calculation is based on Bellemare and Wichman (2020). The 95 per cent confidence intervals shown are based on robust standard errors with two-way clustering by country and industry.
Box 3.5. Promoting equal opportunities when demand for skills changes
Digitalisation is changing the ways in which people work, learn and earn across the EBRD regions, creating new opportunities for some while threatening to marginalise others. Remote-working possibilities, for example, can unlock new economic opportunities for workers with the right digital skills who are less mobile than others.

Source: ILOSTAT database, IMF and authors’ calculations based on modelled ILO estimates.
Note: Low-skill occupations comprise ISCO-88 groups 5, 6 and 9 (service workers and shop and market sales workers; skilled agricultural and fishery workers; and elementary occupations). Medium-skill occupations comprise groups 4, 7 and 8 (clerks; craft and related trades workers; and plant and machine operators and assemblers). High-skill occupations comprise groups 1, 2 and 3 (legislators, senior officials and managers; professionals; and technicians and associate professionals).
Box 3.6. Is there too much automation?
There is enormous potential for digitalisation to improve the productivity of human effort. However, achieving a socially optimal level of digitalisation may be difficult. On the one hand, to the extent that new technologies such as software are costly to develop but easy to copy, their supply is sometimes lower than would be socially optimal. Tax systems often attempt to correct this by providing incentives to invest in R&D, which helps to create new, more productive jobs.
References
D. Acemoğlu, D.H. Autor, J. Hazell and P. Restrepo (2020a)
“AI and jobs: Evidence from online vacancies”, NBER Working Paper No. 28257.
D. Acemoğlu, A. Manera and P. Restrepo (2020b)
“Does the US Tax Code Favor Automation?”, NBER Working Paper No. 27052.
D. Acemoğlu and P. Restrepo (2019)
“Automation and new tasks: How technology displaces and reinstates labor”, Journal of Economic Perspectives, Vol. 33, No. 2, pp. 3-30.
D. Acemoğlu and P. Restrepo (2020)
“Robots and jobs: Evidence from US labor markets”, Journal of Political Economy, Vol. 128, No. 6, pp. 2188-2244.
A. Adams-Prassl, T. Boneva, M. Golin and C. Rauh (2020)
“Inequality in the impact of the coronavirus shock: Evidence from real time surveys”, Journal of Public Economics, Vol. 189, Article 104245.
J. Adema, C.G. Aksoy and P. Poutvaara (2021)
“Mobile Internet Access and Desire to Migrate”, EBRD working paper, forthcoming.
C.G. Aksoy, B. Ozcan and J. Philipp (2021)
“Robots and the gender pay gap in Europe”, European Economic Review, Vol. 134, Article 103693.
L. Alekseeva, J. Azar, M. Giné, S. Samila and B. Taska (2021)
“The demand for AI skills in the labor market”, Labour Economics, Vol. 71, Article 102002.
D. Altig, S.R. Baker, J.M. Barrero, N. Bloom, P. Bunn, S. Chen, S.J. Davis, J. Leather, B.H. Meyer, E. Mihaylov, P. Mizen, N.B. Parker, T. Renault, P. Smietanka and G. Thwaites (2020)
“Economic uncertainty before and during the COVID-19 pandemic”, Journal of Public Economics, Vol. 191, Article 104274.
M. Angelici and P. Profeta (2020)
“Smart-working: work flexibility without constraints”, CESifo Working Paper No. 8165.
M. Angelucci, M. Angrisani, D.M. Bennett, A. Kapteyn and S.G. Schaner (2020)
“Remote work and the heterogeneous impact of COVID-19 on employment and health”, NBER Working Paper No. 27749.
D. Ardila, A.P. Kiraly, S. Bharadwaj, B. Choi, J.J. Reicher, L. Peng, D. Tse, M. Etemadi, W. Ye, G. Corrado, D.P. Naidich and S. Shetty (2019)
“End-to-end lung cancer screening with three-dimensional deep learning on low-dose chest computed tomography”, Nature Medicine, Vol. 25, No. 6, pp. 954-961.
J.M. Barrero, N. Bloom and S.J. Davis (2021)
“Why working from home will stick”, NBER Working Paper No. 28731.
M. Bellemare and C. Wichman (2020)
“Elasticities and the inverse hyperbolic sine transformation”, Oxford Bulletin of Economics and Statistics, Vol. 82, No. 1, pp. 50-61.
S. Beugelsdijk, H.L.F. De Groot and A.B.T.M. Van Schaik (2004)
“Trust and economic growth: a robustness analysis”, Oxford Economic Papers, Vol. 56, No. 1, pp. 118-134.
N. Bloom, J. Liang, J. Roberts and Z.J. Ying (2015)
“Does working from home work? Evidence from a Chinese experiment”, The Quarterly Journal of Economics, Vol. 130, No. 1, pp. 165-218.
M. Brussevich, E. Dabla-Norris and S. Khalid (2019)
“Is technology widening the gender gap? Automation and the future of female employment”, IMF Working Paper No. 19/91.
E. Brynjolfsson and L.M. Hitt (2003)
“Computing productivity: Firm-level evidence”, The Review of Economics and Statistics, Vol. 85, No. 4, p. 793-808.
F. Calvino, C. Criscuolo, L. Marcolin and M. Squicciarini (2018)
“A taxonomy of digital intensive sectors”, OECD Science, Technology and Industry Working Paper No. 2018/14.
M. Cardona, T. Kretschmer and T. Strobel (2013)
“ICT and productivity: conclusions from the empirical literature”, Information Economics and Policy, Vol. 25, No. 3, pp. 109-125.
Cedefop (2016)
“Farmworkers and gardeners: skills opportunities and challenges”. Available at: https://skillspanorama.cedefop.europa.eu/en/analytical_highlights/farmworkers-and-gardeners-skills-opportunities-and-challenges-2016 (last accessed on 3 September 2021)
P. Choudhury, C. Foroughi and B. Larson (2021)
“Work-from-anywhere: The productivity effects of geographic flexibility”, Strategic Management Journal, Vol. 42, No. 4, pp. 655-683.
M.A. Clemens and M. Mendola (2020)
“Migration from Developing Countries: Selection, Income Elasticity, and Simpson’s Paradox”, IZA Discussion Paper No. 13612.
G. Damioli, V. Van Roy and D. Vertesy (2021)
“The impact of artificial intelligence on labor productivity”, Eurasian Business Review, Vol. 11, No. 1, pp. 1-25.
J. De Leede and J. Kraijenbrink (2014)
“The Mediating Role of Trust and Social Cohesion in the Effects of New Ways of Working: A Dutch Case Study”, Human Resource Management, Social Innovation and Technology, Advanced Series in Management, Vol. 14, pp. 3-20.
J.I. Dingel and B. Neiman (2020)
“How many jobs can be done at home?”, Journal of Public Economics, Vol. 189, Article 104235.
EBRD (2011)
Life in Transition: After the Crisis, London.
EBRD (2018)
Transition Report 2018-19 – Work in Transition, London.
Federal Reserve Bank of Dallas (2020)
“Commuting Patterns During COVID-19 Endure; Minorities Less Likely to Work from Home”. Available at: www.dallasfed.org/research/economics/2020/0901 (last accessed on 3 September 2021)
E.W. Felten, M. Raj and R. Seamans (2018)
“A method to link advances in artificial intelligence to occupational abilities”, AEA Papers and Proceedings, Vol. 108, pp. 54-57.
C.B. Frey and M.A. Osborne (2017)
“The future of employment: How susceptible are jobs to computerisation?”, Technological Forecasting and Social Change, Vol. 114, pp. 254-280.
M. Goos, A. Manning and A. Salomons (2014)
“Explaining job polarization: Routine-biased technological change and offshoring”, American Economic Review, Vol. 104, No. 8, pp. 2509-2526.
G. Graetz and G. Michaels (2018)
“Robots at work”, The Review of Economics and Statistics, Vol. 100, No. 5, pp. 753-768.
F. Grigoli, Z. Koczan and P. Topalova (2020)
“Automation and labor force participation in advanced economies: Macro and micro evidence”, European Economic Review, Vol. 126, Article 103443.
S. Guriev, N. Melnikov and E. Zhuravskaya (2021)
“3G Internet and Confidence in Government”, The Quarterly Journal of Economics, forthcoming.
ITU (2019)
“ITU-D ICT Statistics”. Available at: www.itu.int/en/ITU-D/Statistics/Pages/stat/default.aspx (last accessed on 17 June 2021)
M. Lachowska, A. Mas and S.A. Woodbury (2020)
“Sources of displaced workers’ long-term earnings losses”, American Economic Review, Vol. 110, No. 10, pp. 3231-3266.
A. Mas and A. Pallais (2017)
“Valuing alternative work arrangements”, American Economic Review, Vol. 107, No. 12, pp. 3722-3759.
A. Mas and A. Pallais (2020)
“Alternative work arrangements”, Annual Review of Economics, Vol. 12, pp. 631-658.
E. Moretti (2013)
“Real wage inequality”, American Economic Journal: Applied Economics, Vol. 5, No. 1, pp. 65-103.
OECD (2020)
“Capacity for remote working can affect lockdown costs differently across places”, OECD Policy Responses to Coronavirus (COVID-19), Paris.
P. Oreopoulos, M. Page and A.H. Stevens (2008)
“The Intergenerational Effects of Worker Displacement”, Journal of Labor Economics, Vol. 26, No. 3, pp. 455-483.
R.D. Putnam (1993)
Making Democracy Work: Civic Traditions in Modern Italy, Princeton University Press.
S.S. Rosenthal and W.C. Strange (2020)
“How close is close? The spatial reach of agglomeration economies”, Journal of Economic Perspectives, Vol. 34, No. 3, pp. 27-49.
J. Schaller and A.H. Stevens (2015)
“Short-Run Effects of Job Loss on Health Conditions, Health Insurance, and Health Care Utilization”, Journal of Health Economics, Vol. 43, pp. 190-203.
D.G. Sullivan and T. von Wachter (2009)
“Job Displacement and Mortality: An Analysis using Administrative Data”, The Quarterly Journal of Economics, Vol. 124, No. 3, pp. 1265-1306.
R. Toplensky (2018)
“Multinationals pay lower taxes than a decade ago”, Financial Times, 11 March.
M. Webb (2019)
“The impact of artificial intelligence on the labor market”, SSRN Working Paper No. 3482150.
W.C. Wheaton and M.J. Lewis (2002)
“Urban wages and labor market agglomeration”, Journal of Urban Economics, Vol. 51, No. 3, pp. 542-562.
H. Winner (2005)
“Has tax competition emerged in OECD countries? Evidence from panel data”, International Tax and Public Finance, Vol. 12, No. 5, pp. 667-687.